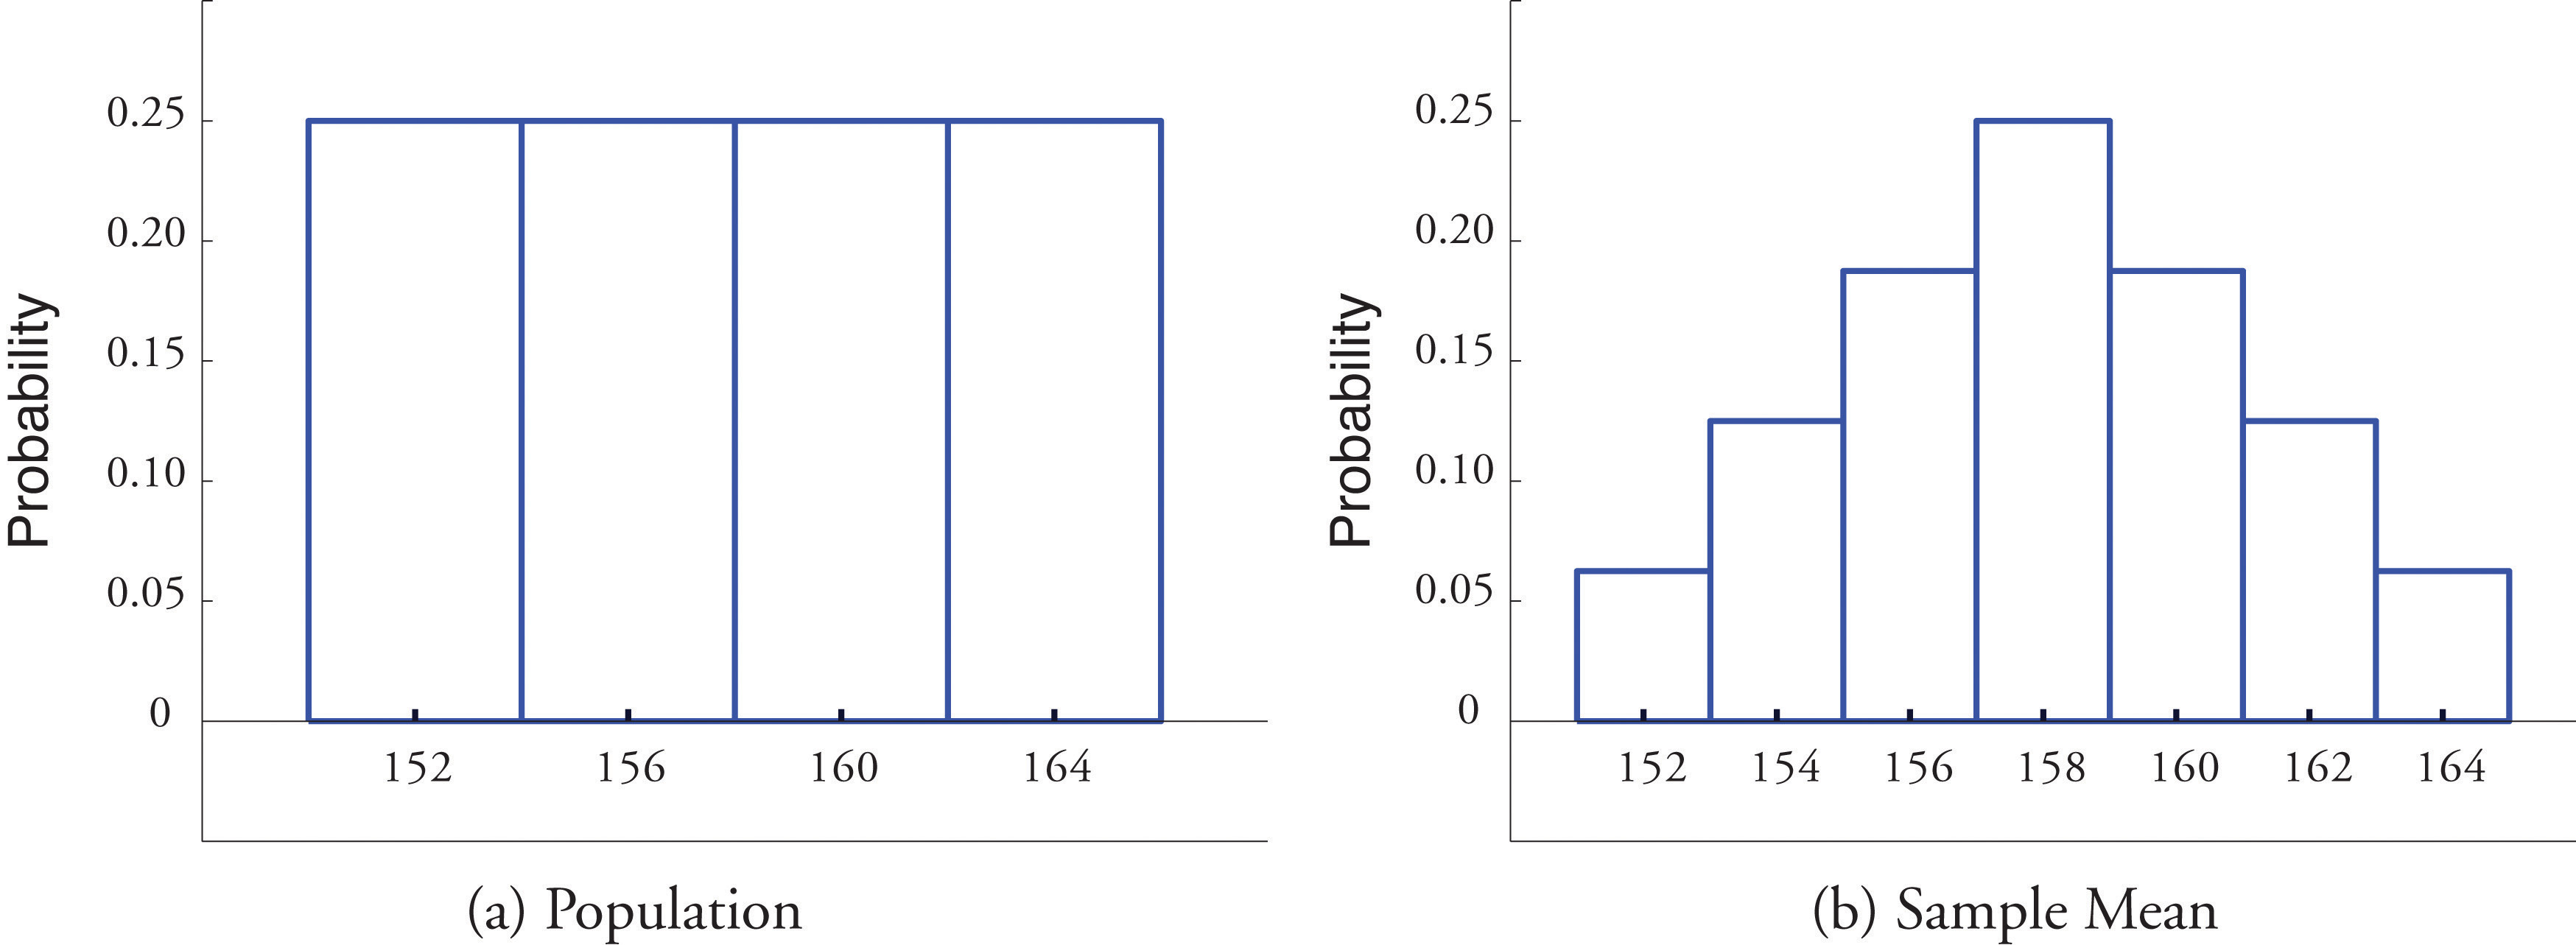
In Example 6.1.1, we constructed the probability distribution of the sample mean for samples of size two drawn from the population of four rowers. The probability distribution is:
\[\begin
Figure \(\PageIndex\) shows a side-by-side comparison of a histogram for the original population and a histogram for this distribution. Whereas the distribution of the population is uniform, the sampling distribution of the mean has a shape approaching the shape of the familiar bell curve. This phenomenon of the sampling distribution of the mean taking on a bell shape even though the population distribution is not bell-shaped happens in general. Here is a somewhat more realistic example.

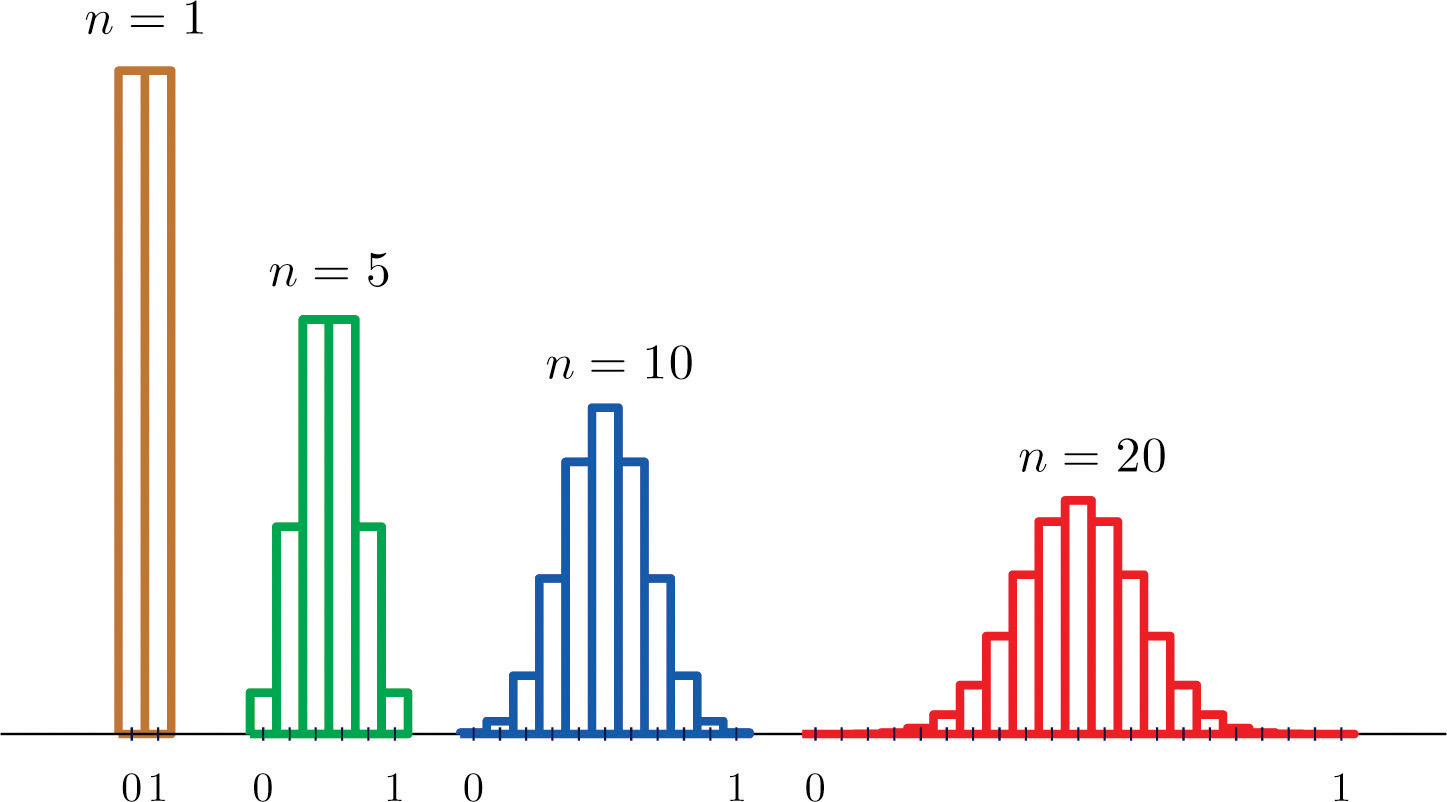
Suppose we take samples of size \(1\), \(5\), \(10\), or \(20\) from a population that consists entirely of the numbers \(0\) and \(1\), half the population \(0\), half \(1\), so that the population mean is \(0.5\). The sampling distributions are:
\[\begin \bar & 0 & 1 \\ \hline P(\bar) &0.5 &0.5 \\ \end \nonumber \]
\[\begin
\[\begin
\[\begin
\[\begin \bar & 0.55 & 0.60 & 0.65 & 0.70 & 0.75 & 0.80 & 0.85 & 0.90 & 0.95 & 1 \\ \hline P(\bar) &0.16 &0.12 &0.07 &0.04 &0.01 &0.00 &0.00 &0.00 &0.00 &0.00 \\ \end \nonumber \]
Histograms illustrating these distributions are shown in Figure \(\PageIndex\).

As \(n\) increases the sampling distribution of \(\overline\) evolves in an interesting way: the probabilities on the lower and the upper ends shrink and the probabilities in the middle become larger in relation to them. If we were to continue to increase \(n\) then the shape of the sampling distribution would become smoother and more bell-shaped.
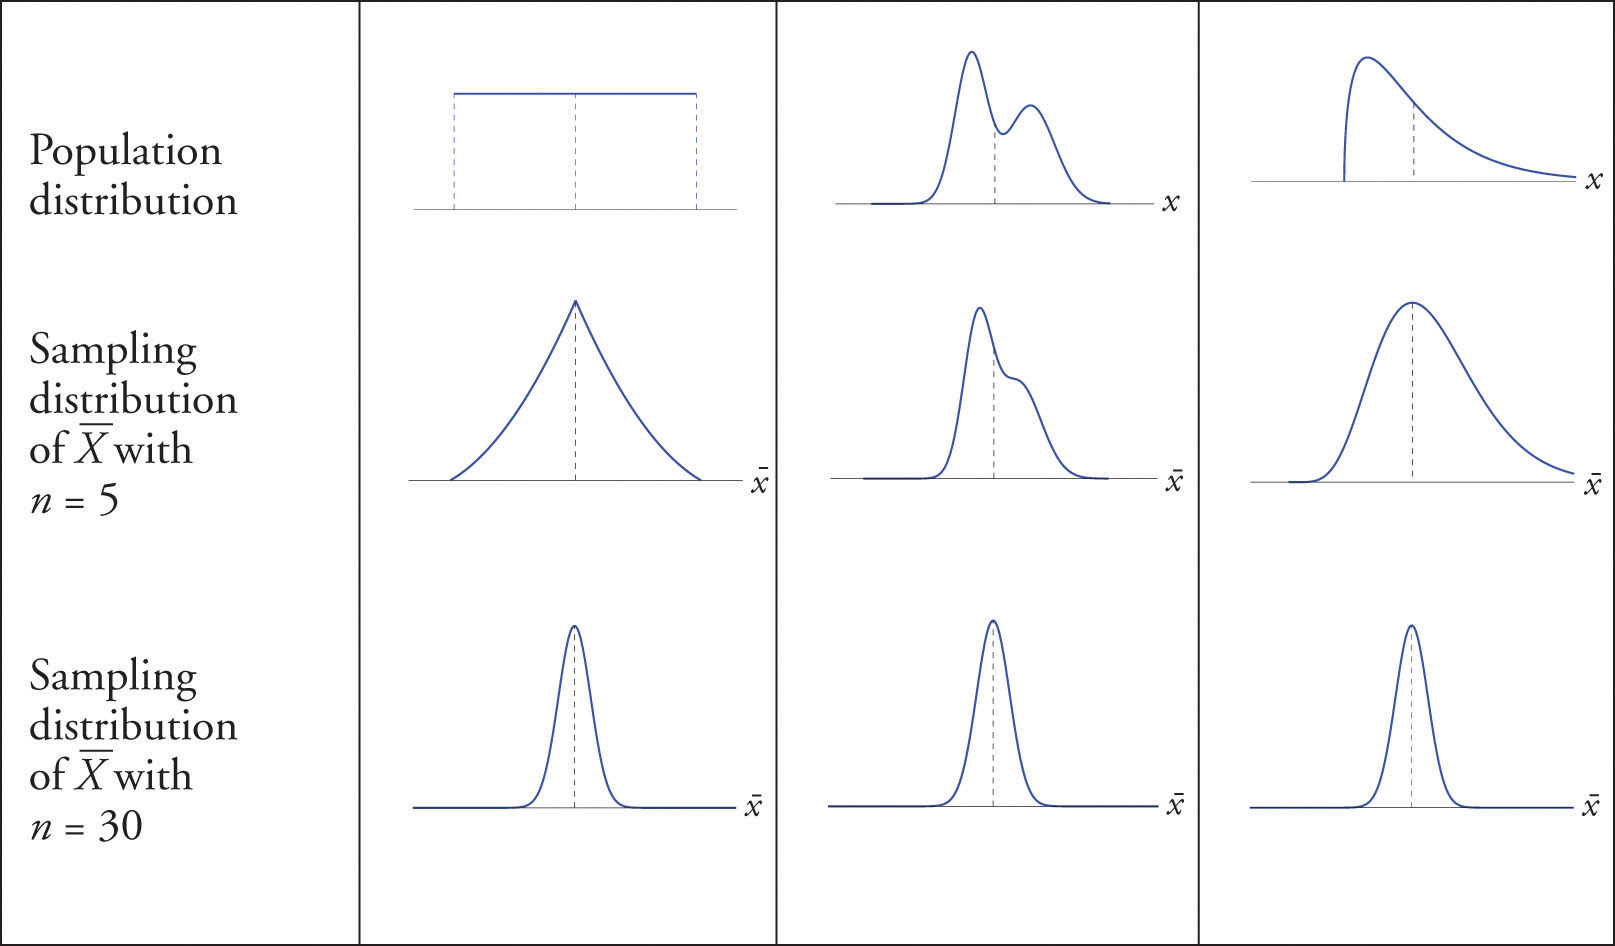
What we are seeing in these examples does not depend on the particular population distributions involved. In general, one may start with any distribution and the sampling distribution of the sample mean will increasingly resemble the bell-shaped normal curve as the sample size increases. This is the content of the Central Limit Theorem.
For samples of size \(30\) or more, the sample mean is approximately normally distributed, with mean \(\mu _<\overline

The dashed vertical lines in the figures locate the population mean. Regardless of the distribution of the population, as the sample size is increased the shape of the sampling distribution of the sample mean becomes increasingly bell-shaped, centered on the population mean. Typically by the time the sample size is \(30\) the distribution of the sample mean is practically the same as a normal distribution.
The importance of the Central Limit Theorem is that it allows us to make probability statements about the sample mean, specifically in relation to its value in comparison to the population mean, as we will see in the examples. But to use the result properly we must first realize that there are two separate random variables (and therefore two probability distributions) at play:
Let \(\overline\) be the mean of a random sample of size \(50\) drawn from a population with mean \(112\) and standard deviation \(40\).
Note that if in the above example we had been asked to compute the probability that the value of a single randomly selected element of the population exceeds \(113\), that is, to compute the number \(P(X>113)\), we would not have been able to do so, since we do not know the distribution of \(X\), but only that its mean is \(112\) and its standard deviation is \(40\). By contrast we could compute \(P(\overline>113)\) even without complete knowledge of the distribution of \(X\) because the Central Limit Theorem guarantees that \(\overline\) is approximately normal.
The numerical population of grade point averages at a college has mean \(2.61\) and standard deviation \(0.5\). If a random sample of size \(100\) is taken from the population, what is the probability that the sample mean will be between \(2.51\) and \(2.71\)?
The sample mean \(\overline\) has mean \(\mu _<\overline>=\mu =2.61\) and standard deviation \(\sigma _<\overline>=\dfrac>=\dfrac=0.05\), so
The Central Limit Theorem says that no matter what the distribution of the population is, as long as the sample is “large,” meaning of size \(30\) or more, the sample mean is approximately normally distributed. If the population is normal to begin with then the sample mean also has a normal distribution, regardless of the sample size.
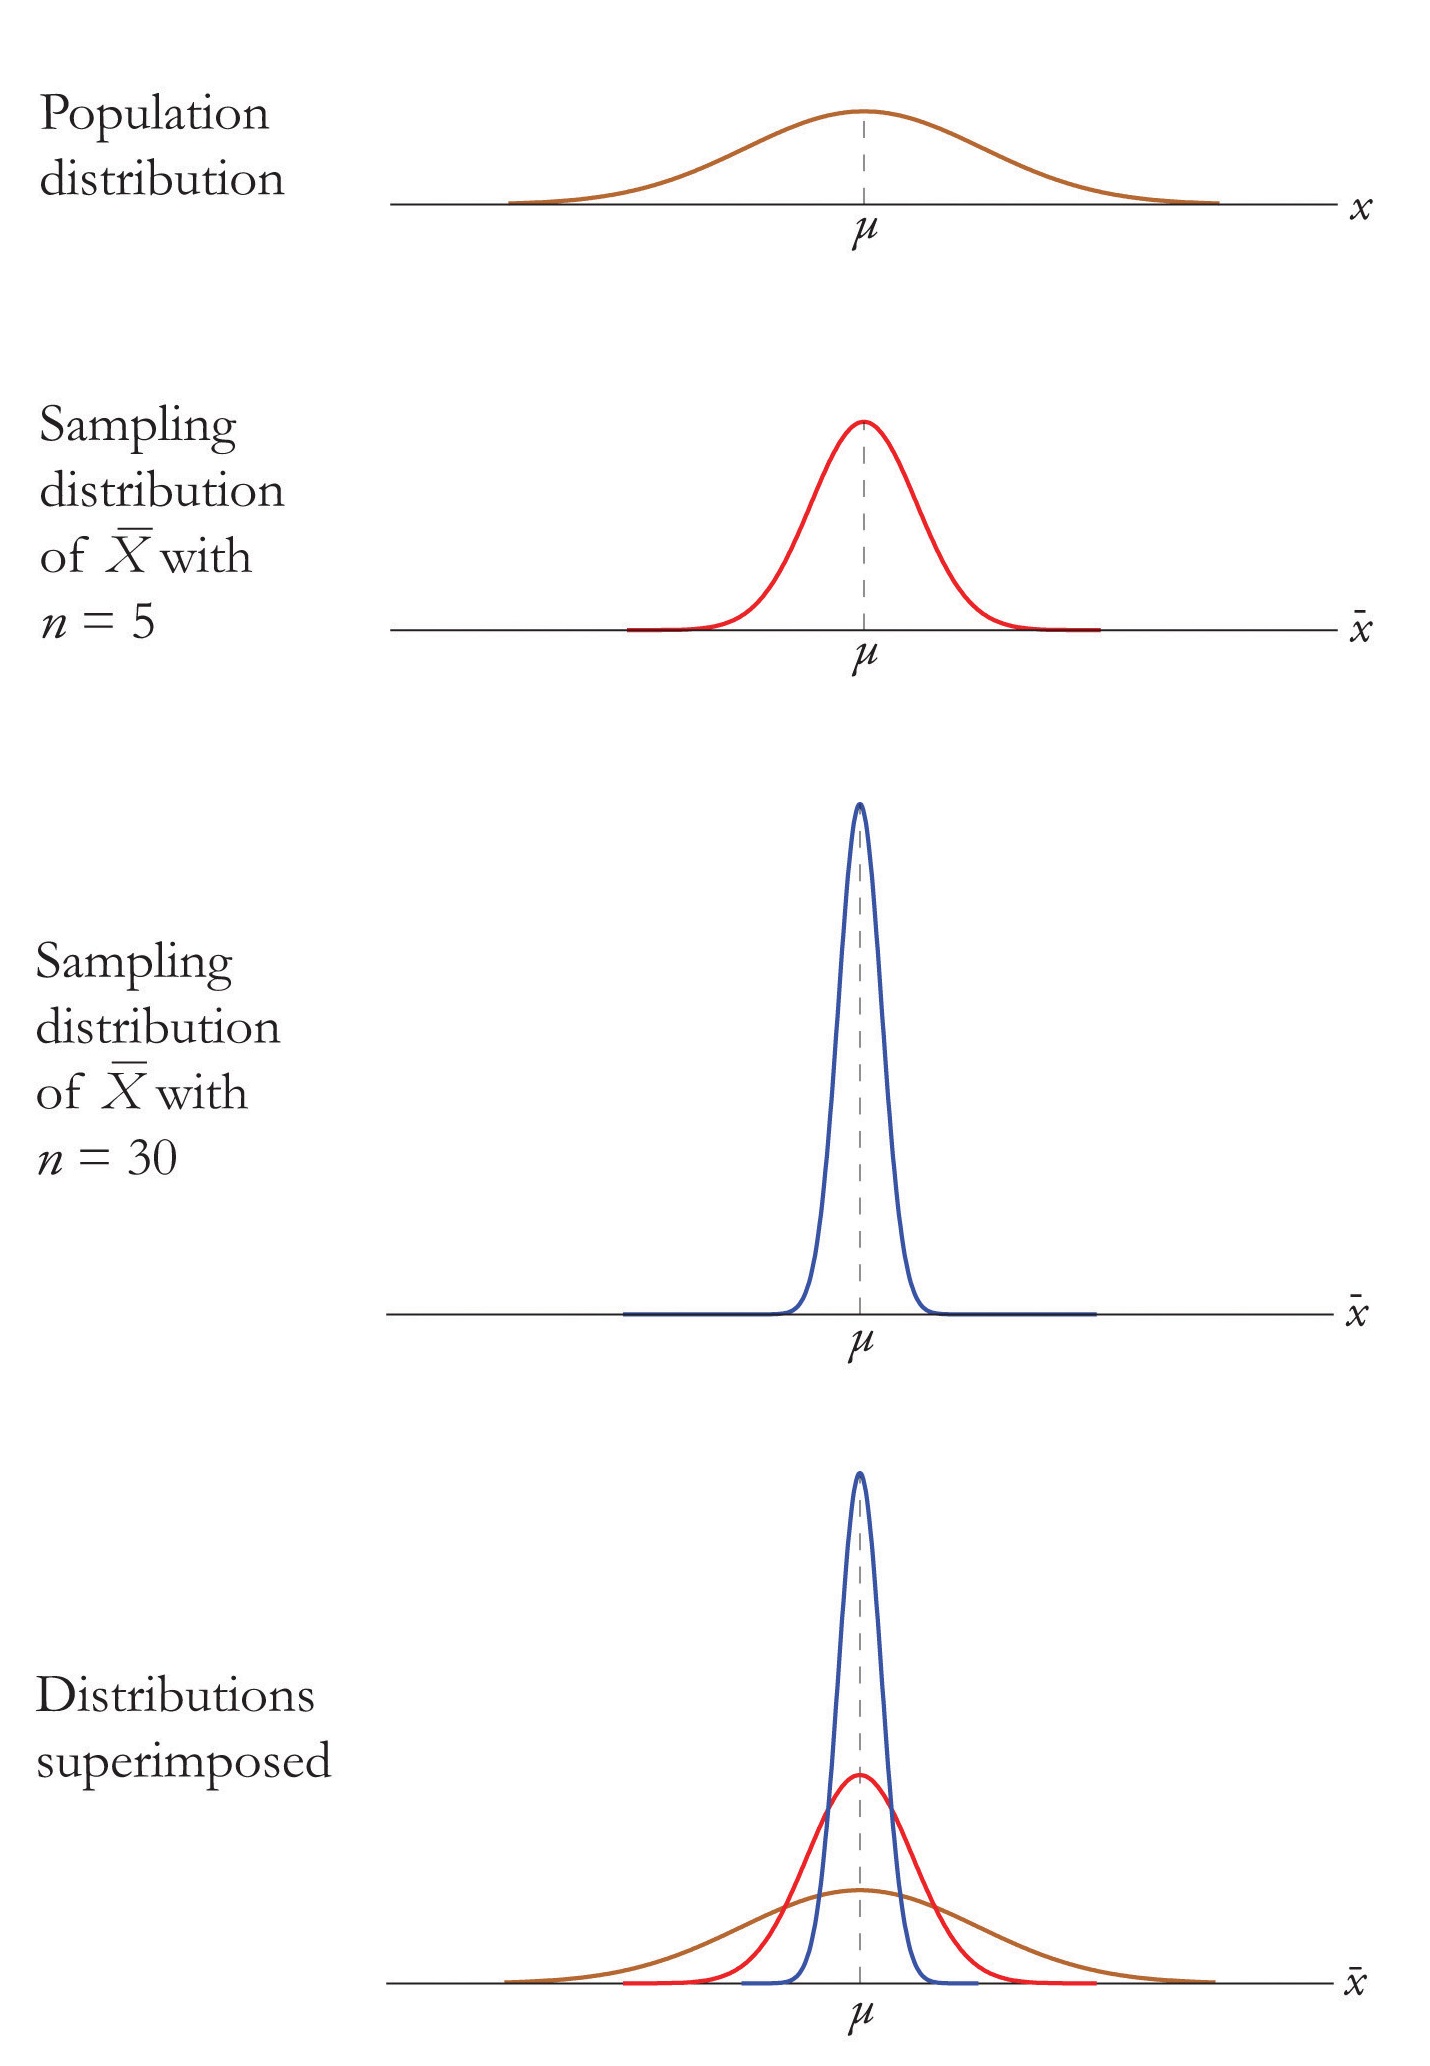
For samples of any size drawn from a normally distributed population, the sample mean is normally distributed, with mean \(μ_X=μ\) and standard deviation \(σ_X =σ/\sqrt\), where \(n\) is the sample size.
The effect of increasing the sample size is shown in Figure \(\PageIndex\).

A prototype automotive tire has a design life of \(38,500\) miles with a standard deviation of \(2,500\) miles. Five such tires are manufactured and tested. On the assumption that the actual population mean is \(38,500\) miles and the actual population standard deviation is \(2,500\) miles, find the probability that the sample mean will be less than \(36,000\) miles. Assume that the distribution of lifetimes of such tires is normal.
For simplicity we use units of thousands of miles. Then the sample mean \(\overline\) has mean \(\mu _<\overline>=\mu =38.5\) and standard deviation \(\sigma _<\overline>=\dfrac>=\dfrac>=1.11803\). Since the population is normally distributed, so is \(\overline\), hence
That is, if the tires perform as designed, there is only about a \(1.25\%\) chance that the average of a sample of this size would be so low.
An automobile battery manufacturer claims that its midgrade battery has a mean life of \(50\) months with a standard deviation of \(6\) months. Suppose the distribution of battery lives of this particular brand is approximately normal.
This page titled 6.2: The Sampling Distribution of the Sample Mean is shared under a CC BY-NC-SA 3.0 license and was authored, remixed, and/or curated by Anonymous via source content that was edited to the style and standards of the LibreTexts platform.